Written by: Ameerah
What is EDA
Exploratory data analysis (EDA) is a technique used in statistics to analyze and understand a dataset. It involves a variety of methods, primarily graphical, to get a feel for the data and uncover any interesting patterns, trends, or anomalies.
Here’s a breakdown of the definition along with some examples:
- Uncover patterns and trends: Imagine you’re analyzing sales data. You might use EDA to see if there are any trends in sales over time, perhaps identifying seasonal spikes or slow periods.
- Spot anomalies: EDA can help you identify outliers in your data. For instance, if you’re looking at customer spending habits, EDA might reveal a customer who spent a significantly higher amount than everyone else. This could be a fraudulent purchase that needs investigation.
- Identify relationships between variables: Say you’re analyzing student test scores. EDA could help you see if there’s a relationship between study hours and test scores. This could help you understand how much time students typically need to dedicate to studying for good results.
EDA is generally a preliminary step before more formal statistical analysis or modeling. By understanding the data better through EDA, you can ask the right questions and get more meaningful results from your analysis.

Exploratory Data Analysis (EDA) is Crucial in Data Science
There are several reasons why exploratory data analysis (EDA) is crucial in data science:
- Unveiling Hidden Insights: EDA goes beyond what formal models or hypothesis testing can reveal. By visualizing and summarizing data, it helps discover hidden patterns, relationships, and trends that might not be immediately apparent. This can lead to unexpected findings and deeper understanding of the data.
- Data Quality Check: EDA acts as a quality control step. It helps identify inconsistencies, errors, or missing values within the data. This ensures the data you’re working with is reliable and suitable for further analysis.
- Informs Model Building: Effective data analysis often involves building models to make predictions or classifications. EDA plays a vital role here. It helps you understand the data’s structure and characteristics, allowing you to choose the most appropriate modeling techniques and avoid making wrong assumptions about the data.
- Making Informed Decisions: Ultimately, data analysis is done to gain insights that can inform decisions. EDA provides a clear picture of the data, enabling stakeholders to make well-founded choices based on the evidence revealed by the data itself.
- Agile Decision-Making: By identifying trends and potential issues early on, EDA facilitates faster decision-making. Businesses can proactively address challenges and capitalize on opportunities using the insights gleaned from EDA.
In essence, EDA is like having a conversation with your data before diving into complex analysis. It helps you establish a foundation for a successful data science project.
Limitations of Exploratory Data Analysis (EDA)
While powerful, EDA does have some limitations to consider:
- Subjectivity: EDA often involves interpretation of visualizations. This interpretation can be subjective, and different analysts might draw different conclusions from the same data.
- Confirmatory Bias: There’s a risk of focusing on patterns that confirm your initial assumptions while overlooking others. To mitigate this, it’s important to approach EDA with an open mind and explore the data from various angles.
- Limited Generalizability: EDA findings are specific to the dataset being analyzed. It’s essential to be cautious about generalizing these insights to a broader population without further investigation.
- Computational Cost: For very large datasets, EDA can be computationally expensive, especially when dealing with complex visualizations. In such cases, efficient data sampling techniques might be necessary.
In conclusion, EDA is an invaluable tool for data exploration and understanding. However, it’s crucial to be aware of its limitations to ensure a well-rounded and objective analysis.
EDA Tools – Programming Languages vs. Spreadsheets
Exploratory data analysis (EDA) relies on tools to uncover patterns and trends within your data. While there are various options, two main categories stand out: programming languages and spreadsheet software. Let’s delve deeper into each:
-
Programming Languages: Power and Flexibility
Programming languages offer a robust environment for EDA, especially for complex datasets or tasks. Here’s what makes them so powerful:
- Rich Libraries: Python and R boast extensive libraries specifically designed for data science. These libraries provide pre-built functions for data manipulation, analysis, and visualization, saving you time and effort.
- Python:
- Pandas: This library excels in data manipulation, cleaning, and analysis. It allows you to handle missing values, filter data, and perform aggregations with ease.
- NumPy: The foundation for numerical computing in Python, NumPy offers efficient array operations and mathematical functions, crucial for many EDA tasks.
- Matplotlib & Seaborn: These libraries are powerhouses for creating various data visualizations. From basic histograms to complex scatter plots, you can create informative and customizable graphs to explore your data.
- R:
- ggplot2: A go-to library for creating beautiful and informative visualizations in R. It offers a grammar-based approach, allowing for clear and concise code to generate complex plots.
- dplyr: This library simplifies data manipulation and wrangling tasks in R. You can filter, arrange, and group data with ease, making it easier to explore different subsets of your data.
- tidyr: Reshaping and transforming data is a breeze with tidyr. It allows you to pivot data from wide to long formats and vice versa, facilitating different analysis approaches.
- Python:
- Scalability and Automation: Programming languages are well-suited for handling large datasets. Libraries like Pandas can efficiently work with millions of rows of data, making them ideal for real-world scenarios. Additionally, you can automate repetitive tasks by writing scripts, saving you time and ensuring consistency.
- Flexibility and Customization: The power of programming allows you to tailor your analysis to your specific needs. You can write custom functions to address unique challenges or create visualizations not readily available in pre-built libraries.
-
Spreadsheet Software: Simplicity for Smaller Datasets
Spreadsheet software like Microsoft Excel or Google Sheets offers a familiar and user-friendly environment for basic EDA tasks. Here’s where they shine:
- Accessibility: Most people have some experience with spreadsheets, making them a readily available tool for basic EDA. The user interface is often intuitive, allowing for quick data exploration.
- Basic Data Cleaning: Spreadsheets offer functionalities for handling missing values, formatting data, and performing simple cleaning operations. This can be useful for preparing your data for analysis.
- Descriptive Statistics: You can calculate basic summary statistics like mean, median, and standard deviation using spreadsheet functions. This provides a quick overview of your data’s central tendency and spread.
- Visualization: Spreadsheets offer built-in charting tools for creating basic visualizations like histograms, scatter plots, and bar charts. These can be helpful for getting a preliminary understanding of your data’s distribution and relationships.
However, there are limitations to consider with spreadsheets for EDA:
- Limited Functionality: For complex data manipulation, analysis, or advanced visualizations, spreadsheets quickly reach their limits. They lack the rich libraries and functionalities offered by programming languages.
- Scalability Issues: Spreadsheets become cumbersome and slow when working with large datasets. Calculations can take a long time, and managing large amounts of data can be challenging.
- Limited Automation: Automating repetitive tasks in spreadsheets is difficult compared to programming languages. This can make EDA time-consuming, especially for repetitive analysis steps.
Choosing the Right Tool
The best tool for EDA depends on the complexity of your data and your needs. Here’s a quick guide:
- For small datasets and basic EDA tasks, spreadsheets can be a good starting point.
- For larger datasets, complex analysis, or advanced visualizations, programming languages are the way to go. Python and R offer powerful libraries and functionalities specifically designed for data science.
No matter which tool you choose, remember that EDA is an iterative process. You’ll likely explore your data from multiple angles and refine your analysis as you go.
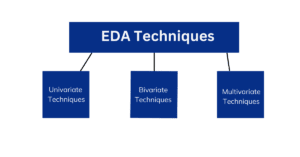
Exploratory Data Analysis (EDA) utilizes a variety of techniques to uncover patterns, trends, and anomalies within a dataset. These techniques can be broadly categorized into looking at one variable at a time (univariate), examining relationships between two variables (bivariate), and exploring interactions among three or more variables (multivariate).
EDA Techniques
Here’s a breakdown of the key EDA techniques:
-
Univariate Techniques
- Focus: Analyze a single variable at a time.
- Goals: Understand the distribution of the data, identify outliers, and get a basic feel for the variable’s characteristics.
- Non-Graphical Techniques:
- Summary Statistics: Calculate measures like mean, median, standard deviation, minimum, and maximum values to understand the data’s central tendency and spread.
- Graphical Techniques:
- Histograms: Visualize the distribution of data points, revealing patterns like skewness or potential outliers.
- Box Plots: Show the distribution of data with quartiles and outliers, giving insights into variability and potential skewness.
- Frequency Tables: Count the occurrences of each unique value in the variable, useful for categorical data.
-
Bivariate Techniques
- Focus: Explore the relationship between two variables.
- Goals: Identify correlations, patterns of interaction, or potential cause-and-effect relationships.
- Non-Graphical Techniques:
- Correlation Coefficients: Calculate a numerical value (like Pearson correlation) to quantify the strength and direction of the linear relationship between two variables.
- Graphical Techniques:
- Scatter Plots: Visualize the relationship between two continuous variables, revealing linear or non-linear trends, clusters, and outliers.
-
Multivariate Techniques
- Focus: Delve into the relationships among three or more variables.
- Goals: Understand how multiple variables interact and influence each other, identify hidden patterns in high-dimensional data.
- Non-Graphical Techniques:
- Principal Component Analysis (PCA): Reduces the dimensionality of the data by identifying the most important underlying factors, making complex datasets more manageable.
- Graphical Techniques:
- Heatmaps: Visualize the correlation between multiple variables as a color-coded matrix, revealing patterns and clusters.
- Parallel Coordinates Plots: Allow you to see how multiple variables change simultaneously for each data point, useful for identifying groups or trends.
- 3D Scatter Plots: Visualize relationships between three continuous variables, although interpretation can be more challenging.
EDA vs. Data Visualization
| Feature | Exploratory Data Analysis (EDA) | Data Visualization |
| Goal | Understand data structure, identify patterns, trends, and anomalies | Communicate information clearly using visual representations |
| Process | Iterative process involving cleaning, summarizing, manipulating data | Uses insights from EDA to choose visualization techniques |
| Output | Insights and understanding gained from exploring data | Clear and informative visual representation (chart, graph, map) |
| Tools | Programming languages (Python, R) with libraries, spreadsheet software (Excel) | Programming language libraries (Matplotlib, Seaborn, ggplot2), dedicated data visualization software |
| Analogy | Examining a new room (turning on lights, looking around) | Showing a picture of the room to someone else (highlighting key features) |
What is the Difference Between Predictive Analysis and EDA?
Both Exploratory Data Analysis (EDA) and predictive analytics are crucial parts of data science, but they serve different purposes:
| Feature | Exploratory Data Analysis (EDA) | Predictive Analytics |
| Goal | Understand data, identify patterns, and uncover relationships | Use data to predict future outcomes or trends |
| Process | Iterative process of cleaning, summarizing, and visualizing data | Build models based on historical data to make predictions |
| Output | Insights and understanding of the data | Predictions about future events or classifications |
| Focus | What is happening in the data? | What will happen in the future? |
| Examples | Identifying trends in customer purchases, spotting outliers in sensor data | Predicting customer churn, forecasting sales figures |
key differences:
- Focus: EDA focuses on understanding the present state of your data. It’s about uncovering patterns, trends, and relationships within the data itself. Predictive analytics, on the other hand, is all about the future. It uses historical data to build models that can predict what might happen next.
- Process: EDA is an exploratory process. You don’t have a predefined hypothesis, and the analysis is iterative. You might clean the data, visualize it, and then go back and clean it some more based on what you see. Predictive analytics is more structured. You use the insights from EDA to build models based on specific assumptions about the data. These models are then trained on historical data to learn patterns and relationships.
- Output: The output of EDA is a deeper understanding of your data. You gain insights that can be used to formulate hypotheses, make informed decisions, or guide further analysis. The output of predictive analytics is a prediction about the future. You get a model that can be used to forecast future events or classify new data points.
Analogy: Imagine you’re planning a road trip. EDA is like studying a map, understanding the terrain, and identifying potential traffic jams. Predictive analytics is like using a weather forecast to predict if you might encounter rain along the way. EDA helps you understand the current landscape, while predictive analytics helps you anticipate what might be coming up.
EDA and predictive analytics are complementary techniques. EDA provides the foundation for understanding your data, and this understanding is crucial for building effective predictive models.
Conclusion
Exploratory Data Analysis (EDA) is a powerful technique for understanding and uncovering insights from your data. It serves as the foundation for any successful data science project, providing a clear picture of your data before diving into complex analysis or model building. By understanding the strengths and weaknesses of EDA tools like spreadsheets and programming languages, you can choose the right approach for your data and analysis goals.
FAQs
What are the benefits of using EDA?
- Unveils hidden patterns and relationships within your data.
- Acts as a data quality check, identifying inconsistencies and errors.
- Informs model building by providing insights into data structure and characteristics.
- Enables making informed decisions based on the data’s revealed evidence.
- Facilitates agile decision-making by identifying trends and potential issues early on.
What are the limitations of EDA?
- Can be subjective, with interpretations of visualizations varying between analysts.
- There’s a risk of confirmation bias, focusing on patterns that confirm initial assumptions.
- Findings are specific to the analyzed dataset, limiting generalizability.
- Large datasets can make EDA computationally expensive, especially for complex visualizations.
When should I use spreadsheets for EDA?
Spreadsheets are a good starting point for:
- Small datasets.
- Basic EDA tasks like simple cleaning, visualization, and summary statistics.
- Users comfortable with the spreadsheet interface.
When should I use programming languages for EDA?
Programming languages are ideal for:
- Larger datasets.
- Complex data manipulation, analysis, and advanced visualizations.
- Automating repetitive tasks and customizing analysis approaches.
- Users with programming experience or willing to learn.
What are some popular programming languages for EDA?
- Python (with libraries like Pandas, NumPy, Matplotlib, Seaborn)
- R (with libraries like ggplot2, dplyr, tidyr)